The Inventory Reports page is your central tool for financial analysis and operational oversight, allowing you to track inventory movement trends and calculate the total monetary value of your stock.
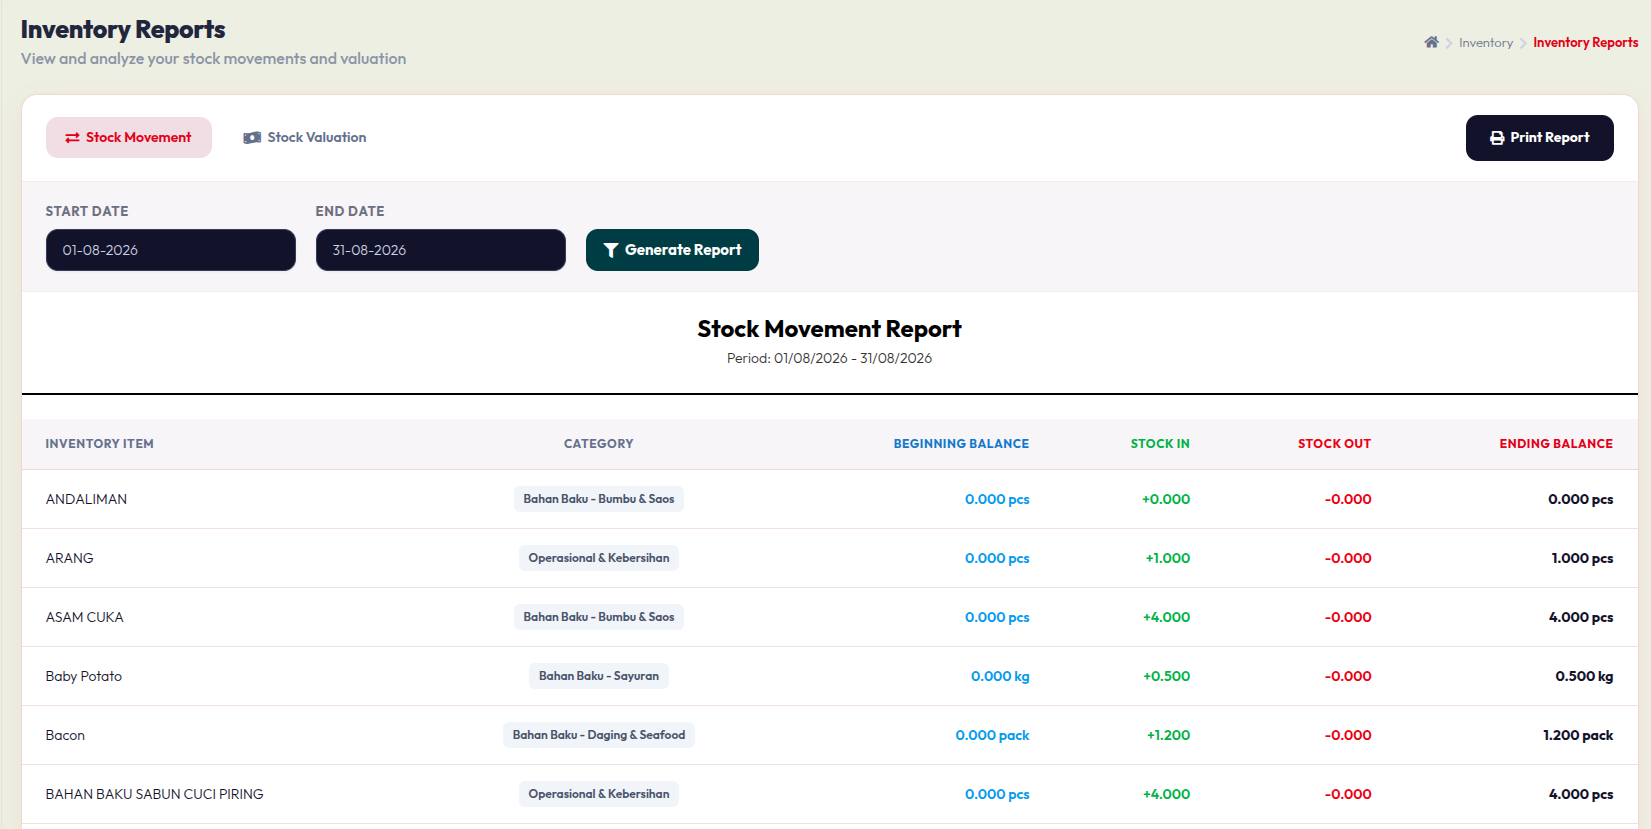
1. Stock Movement Report
This report provides a periodic breakdown of how your stock levels have changed. Follow these steps to generate it:
- Select Period: Click the Start Date and End Date fields to choose the timeframe you wish to analyze.
- Generate Report: Click the Generate Report button to load the data.
- Understanding the Table: The report displays:
- Beginning Balance: Your starting stock level at the beginning of the period.
- Stock In / Out: The total quantity added to or removed from inventory during this time.
- Ending Balance: Your final stock count at the end of the period.
- Print: Click the Print Report button on the top right to download or print a physical copy of the analysis.
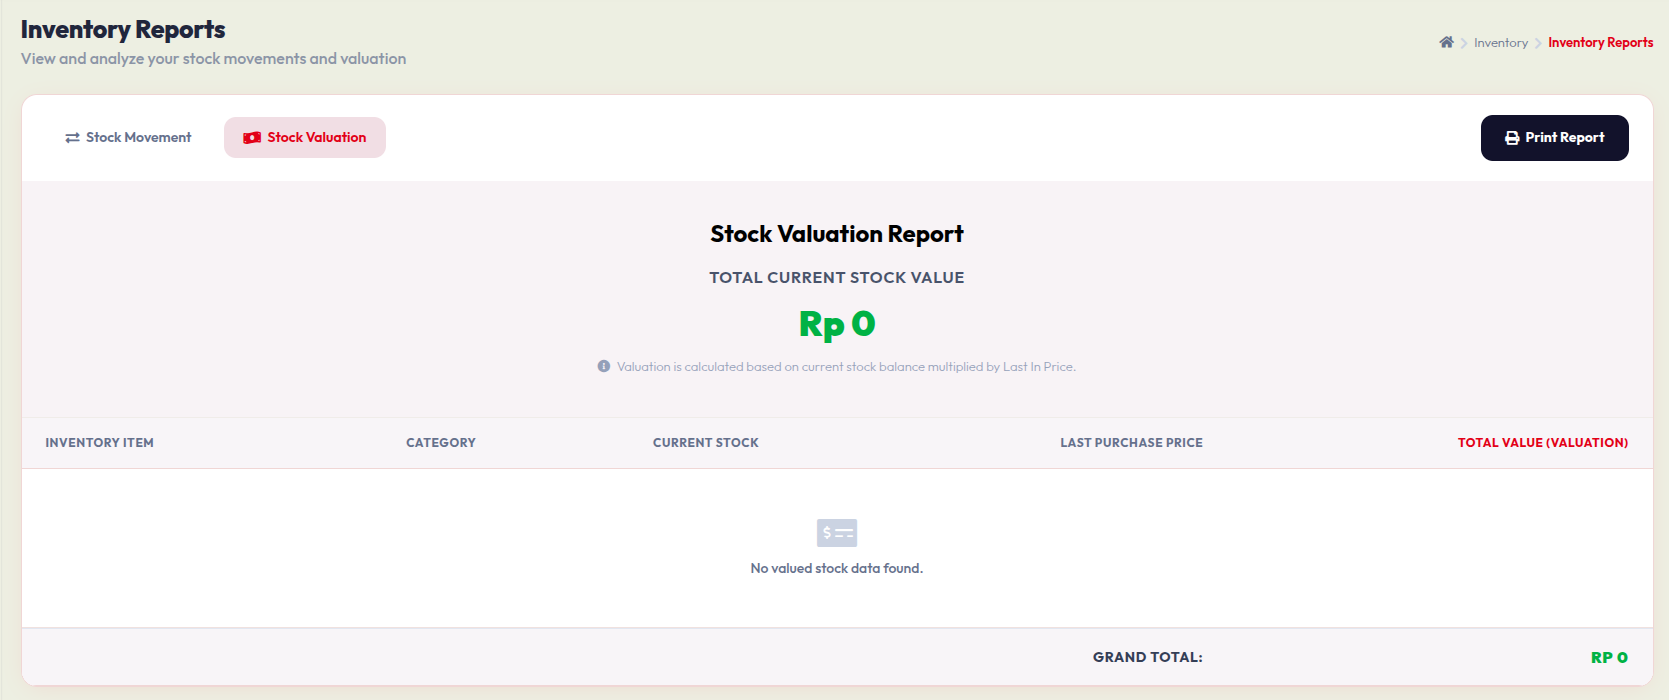
2. Stock Valuation Report
This report offers a financial perspective on your current inventory holdings.
- Click the Stock Valuation tab to switch views.
- Total Current Stock Value: The system automatically calculates the total monetary worth of all items currently in your warehouse.
- Calculation Method: Valuation is determined by multiplying your current stock balance by the Last In Price (the most recent purchase cost).
- Itemized View: The table lists every Inventory Item, its Category, the Current Stock level, its Last Purchase Price, and the resulting Total Value.
- Grand Total: The bottom of the page displays the aggregate value of your entire inventory.