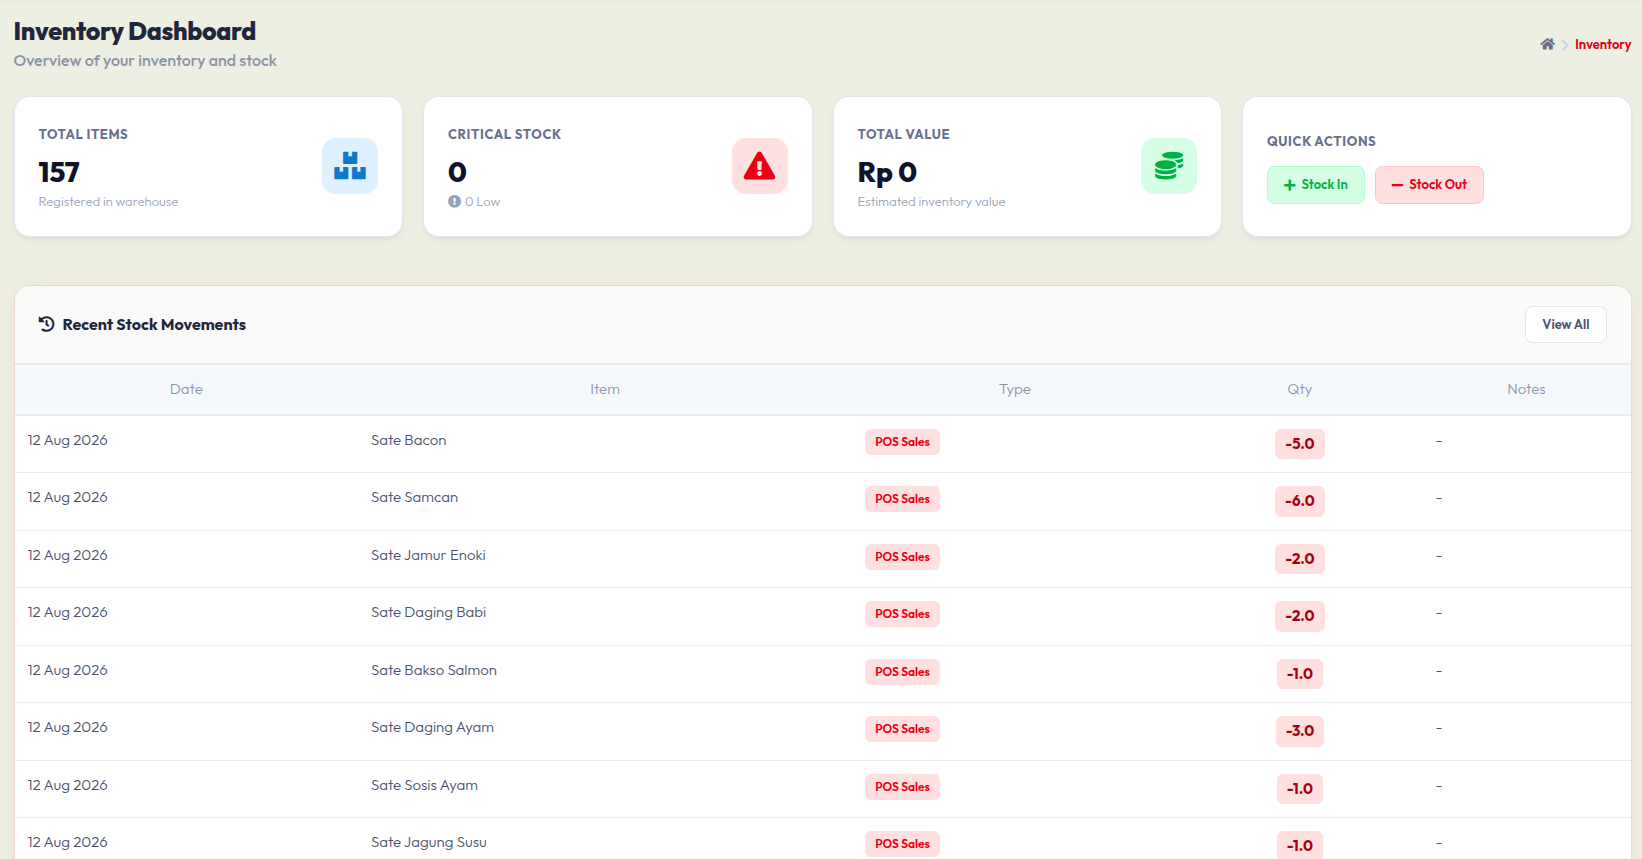
 1. Summary Cards (Top Section)
These four cards give you a quick snapshot of your warehouse status:
- Total Items: Displays the total number of unique products currently registered in your warehouse (e.g., 157).
- Critical Stock: Shows the number of items that are running low or are completely out of stock. A warning icon indicates if immediate restocking is needed.
- Total Value: Represents the estimated financial value of all the inventory you currently hold in Rupiah (Rp).
- Quick Actions: Use these buttons to manually adjust your stock levels without waiting for a sales transaction:
- + Stock In: Click this to manually add new stock to the warehouse (e.g., receiving supplies from a vendor).
- - Stock Out: Click this to manually deduct stock (e.g., for damaged goods, expired items, or internal use).
2. Recent Stock Movements (Bottom Section)
This table acts as a logbook, tracking every time stock goes in or out.
- View All Button: Located on the top right of the table, click this to see the complete history of your inventory changes.
- Table Columns:Date: The exact date the stock change occurred.
- Item: The name of the product that was affected (e.g., "Sate Bacon").
- Type: The reason or source of the movement. For example, POS Sales means the stock was automatically deducted because a customer bought the item through the Point of Sale system.
- Qty (Quantity): The amount of stock changed. A negative number (e.g., -5.0) means stock left the warehouse. A positive number means stock was added.
- Notes: Any extra details or manual remarks entered during a stock adjustment.